From your first question to patient stratification linked to trials running today. Every figure and number below came from a real run on Tag.bio data. Connect Tag.bio, copy a prompt, and ask follow-ups in plain language.
Tag.bio holds curated datasets (data products): cancer genomics, a kidney cancer trial, hospital costs and reference data. Each is one big table with one row per patient, sample or record.
Prompt
Using Tag.bio, which data products can I use and what is in each one?
Phase III trial, avelumab + axitinib vs sunitinib: PD-L1, PFS, expression
886 patients
Vizient Healthcare Costs
Hospital encounters: diagnosis groups, hospitals, length of stay, extra cost
78,651 encounters
Gene Annotation
Genes, GO terms, pathways, gene sets
61,174 genes
Variant Annotation
ClinVar, SIFT/PolyPhen, consequences
3,035,141 variants
Look inside one dataset
Ask what a data product contains and which analyses it can run. The answer lists its columns (collections) and its built-in analyses, which you can then ask for by name.
Prompt
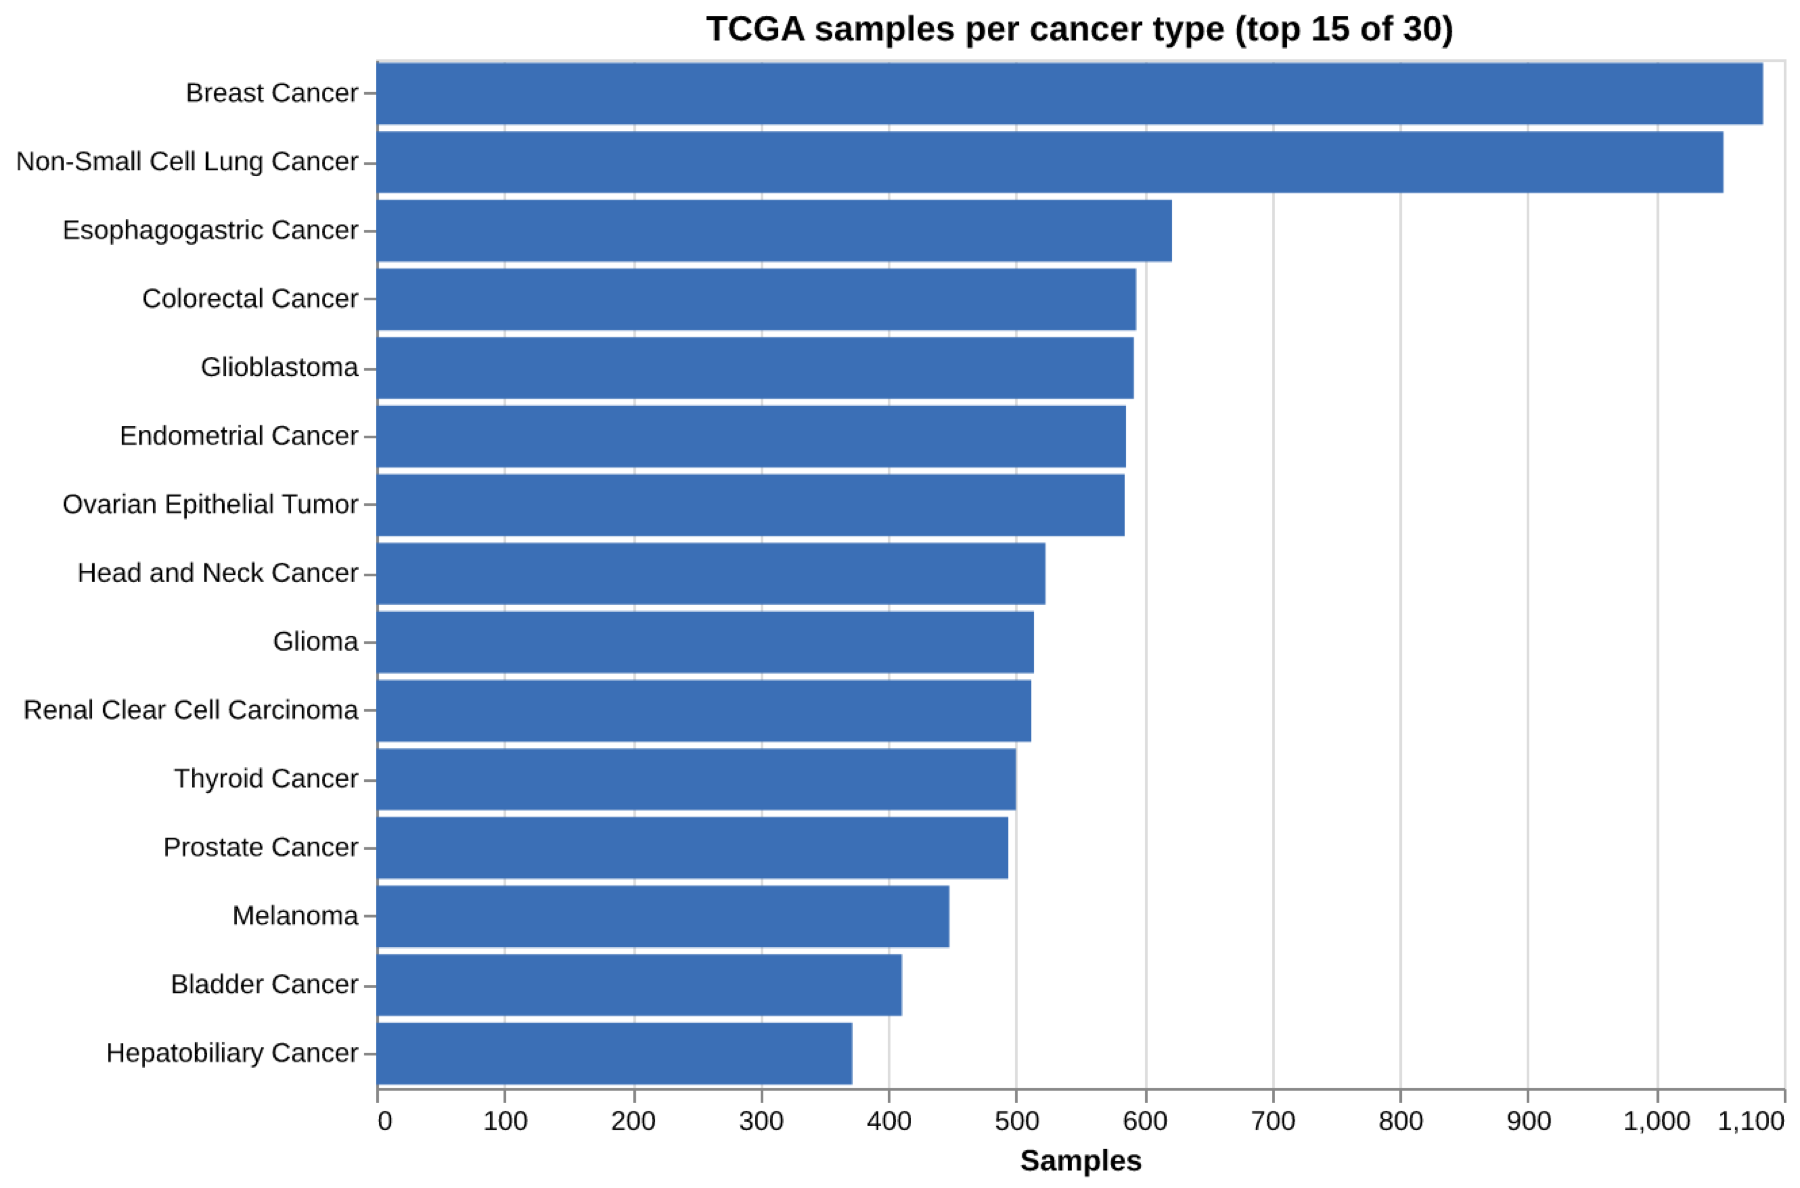
What is in the Tag.bio TCGA data product, and what analyses can I run on it?
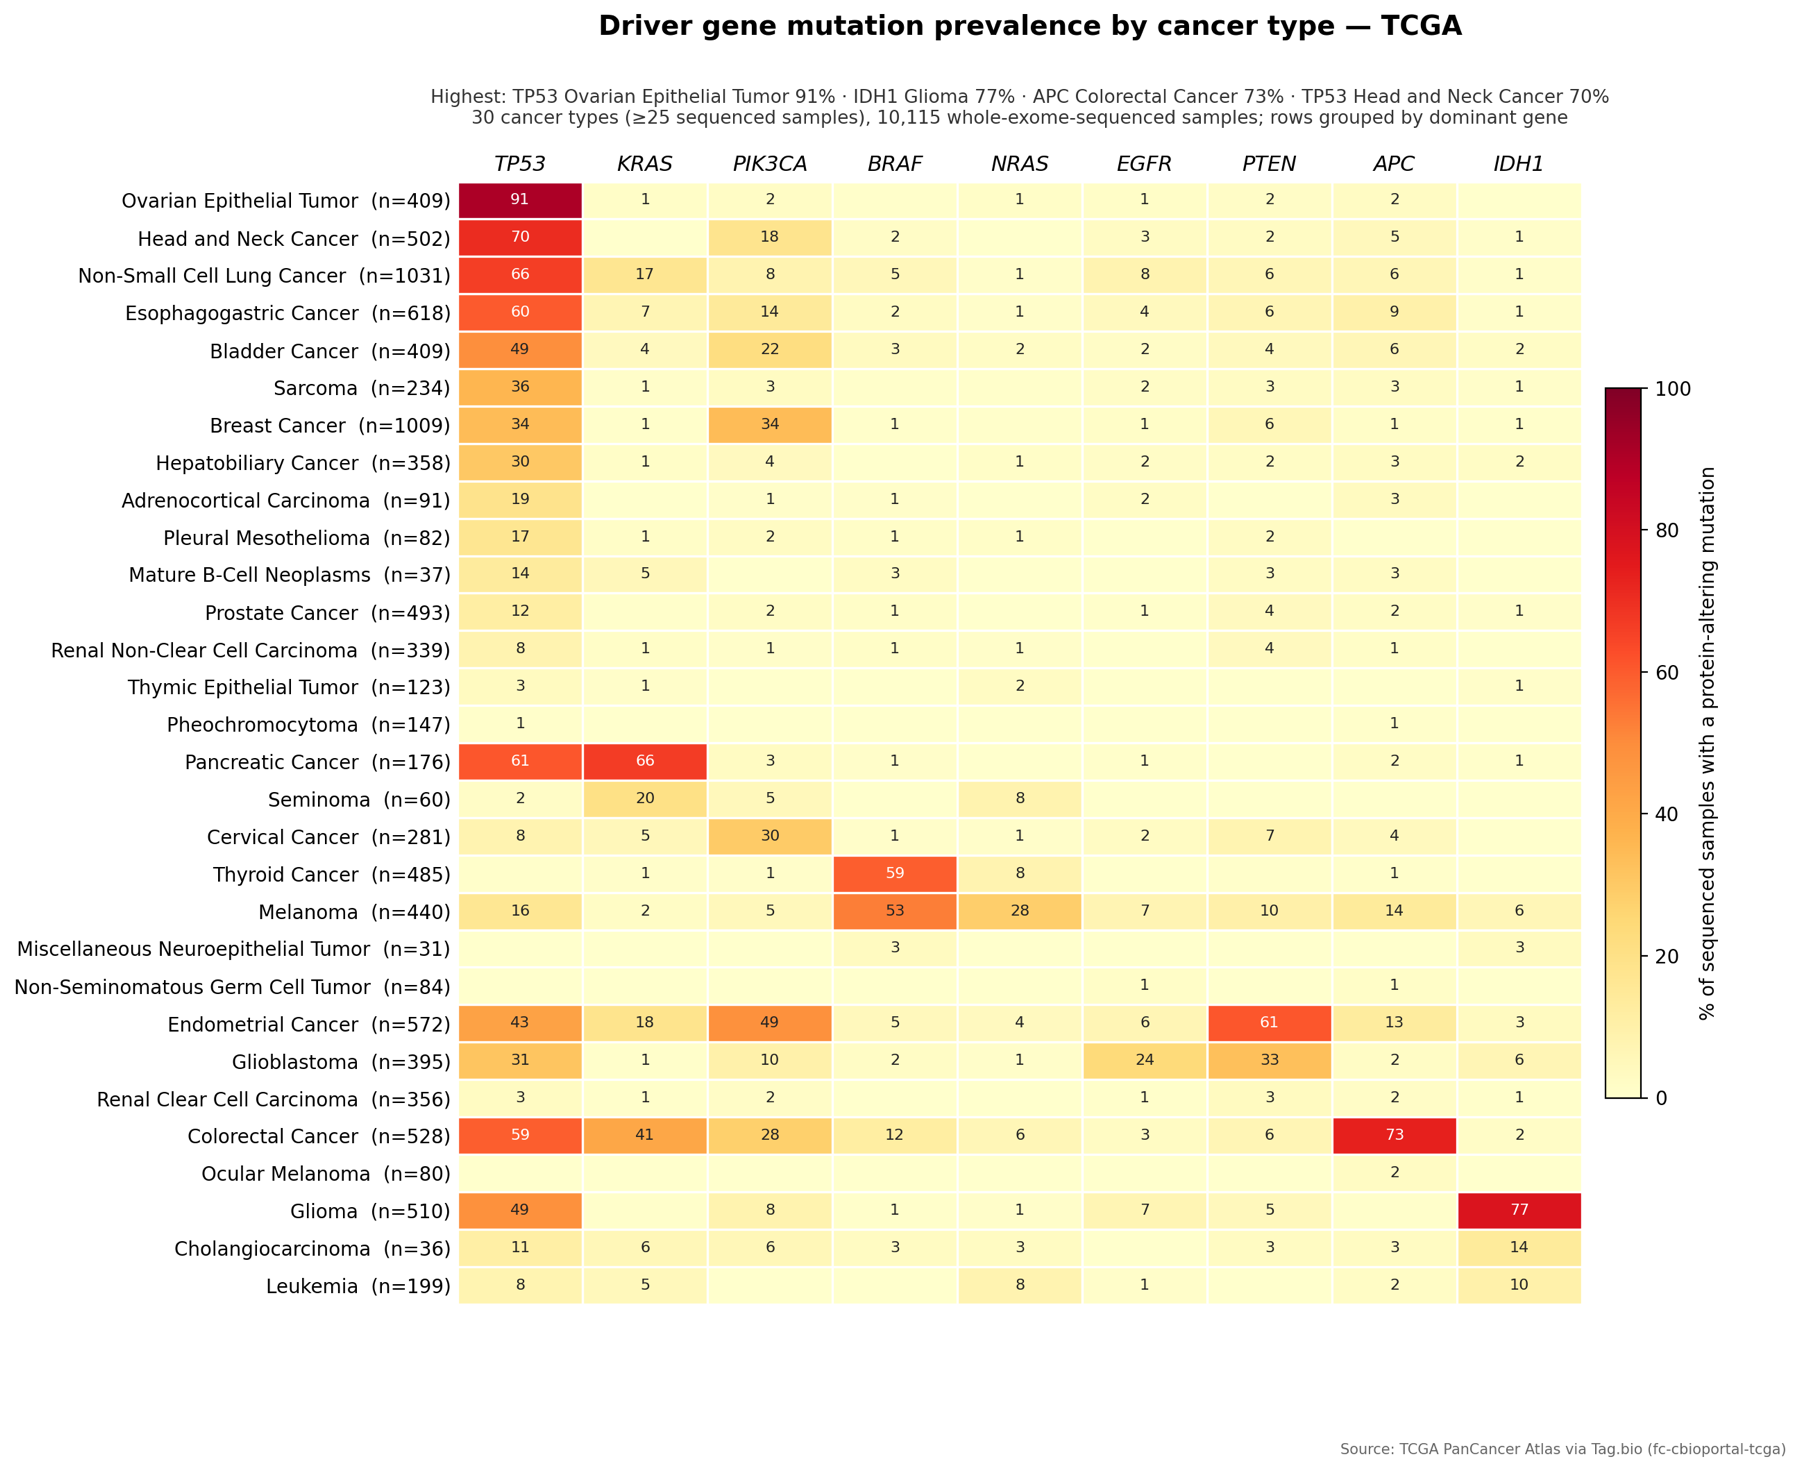
A driver gene is one whose mutation helps a cancer grow. This heatmap shows, for each cancer type, the share of tumors with each driver mutated.
Prompt
Across Tag.bio TCGA, which driver genes are mutated in which cancer types? Show a cancer type × gene heatmap of the % of sequenced samples with a protein-altering mutation in TP53, KRAS, PIK3CA, BRAF, NRAS, EGFR, PTEN, APC and IDH1. Make it publication quality: a title, a subtitle with the key numbers, a legend and a source note.
TP53 in 91% of ovarian tumors; IDH1 in 77% of gliomas; APC in 73% of colorectal tumors.
KRAS in 66% of pancreatic tumors; BRAF in 59% of thyroid and 53% of melanoma; PTEN in 61% of endometrial.
Counts protein-altering mutations only; silent and intronic calls would inflate the numbers.
Built-in analyses
Each data product ships curated analyses that run next to the data in seconds.
A map of all tumors
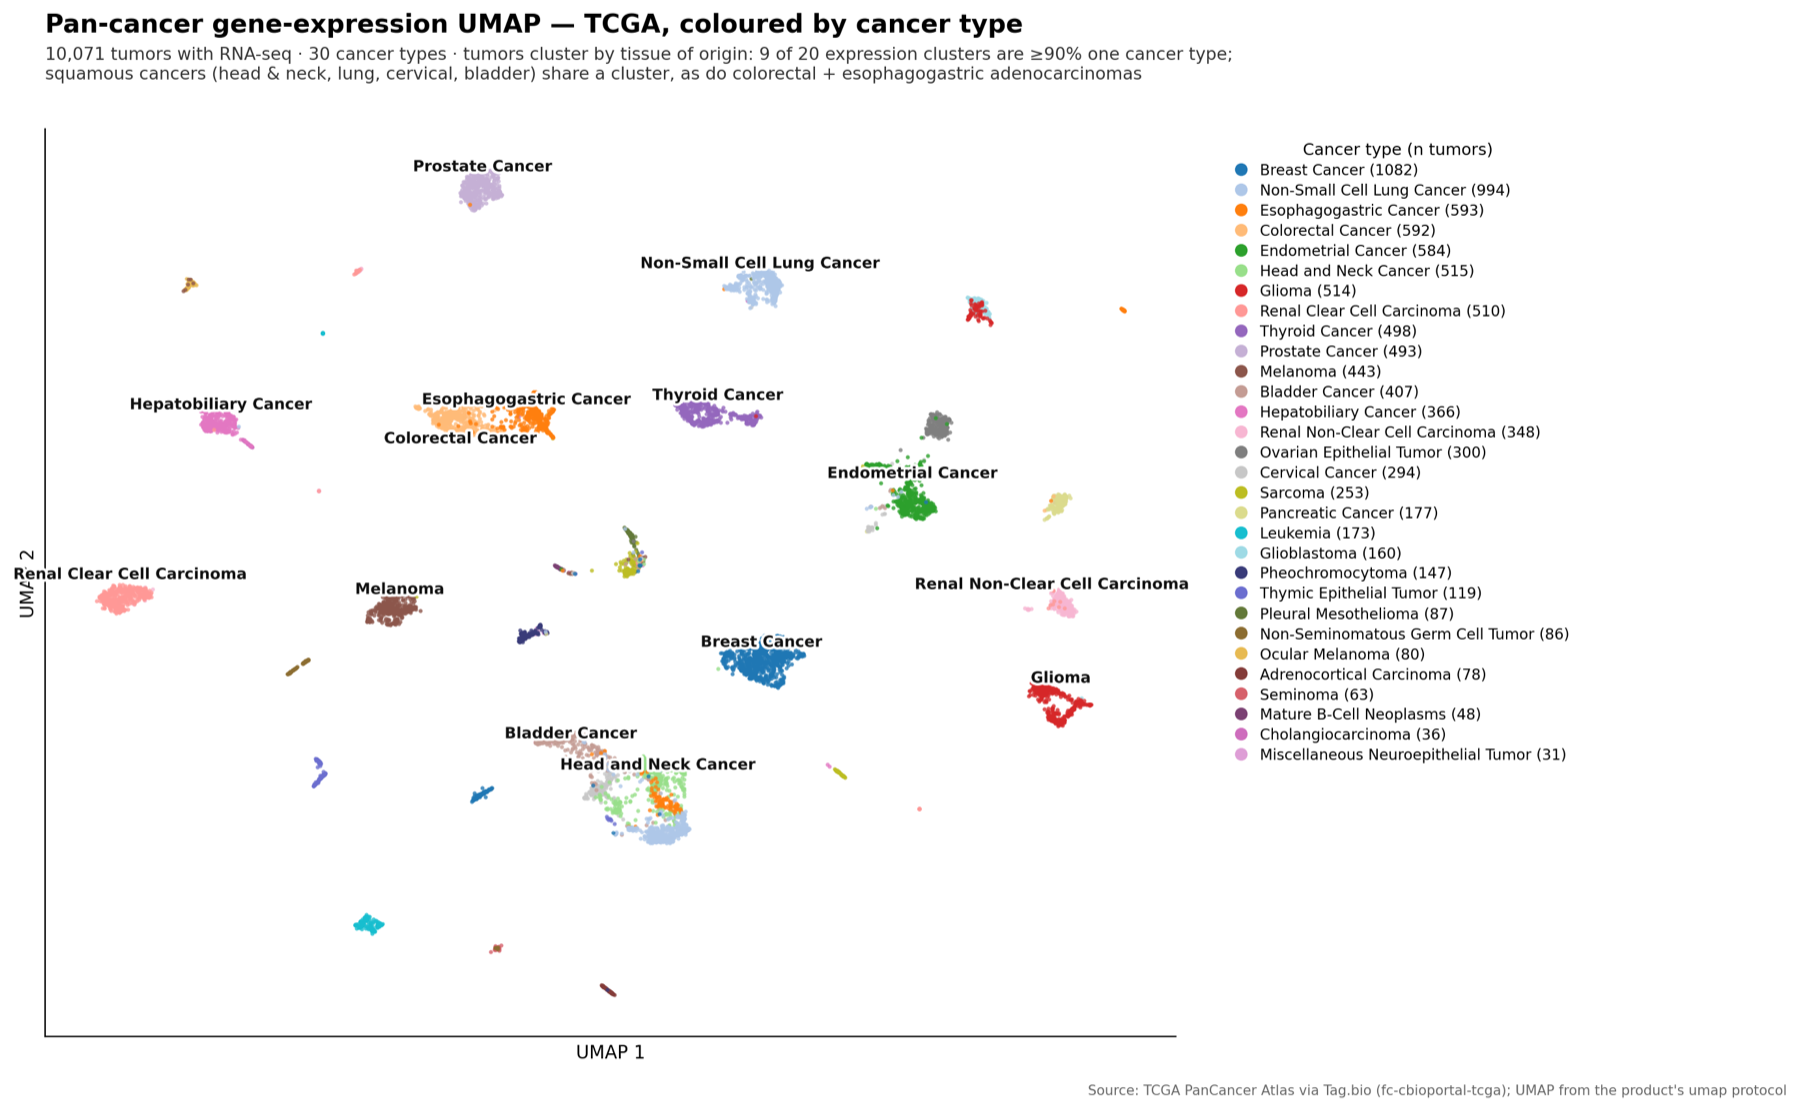
UMAP squeezes the activity of thousands of genes into one picture, so tumors that behave alike sit close together. Coloring by cancer type shows tumors grouping by the tissue they came from.
Prompt
Run a UMAP of the Tag.bio TCGA samples by gene expression and color it by cancer type.
Follow-up for this figure
Redraw that UMAP from the full labeled table: all points, a distinct color per cancer type, labels on the largest groups, and a subtitle summarizing how pure the clusters are.
10,071 tumors with RNA-seq. 9 of 20 clusters are at least 90% one cancer type (thyroid 99.8%, kidney clear cell 98.5%).
Squamous tumors from head and neck and lung share a cluster, as do colorectal and stomach adenocarcinomas.
A clinical trial's own data
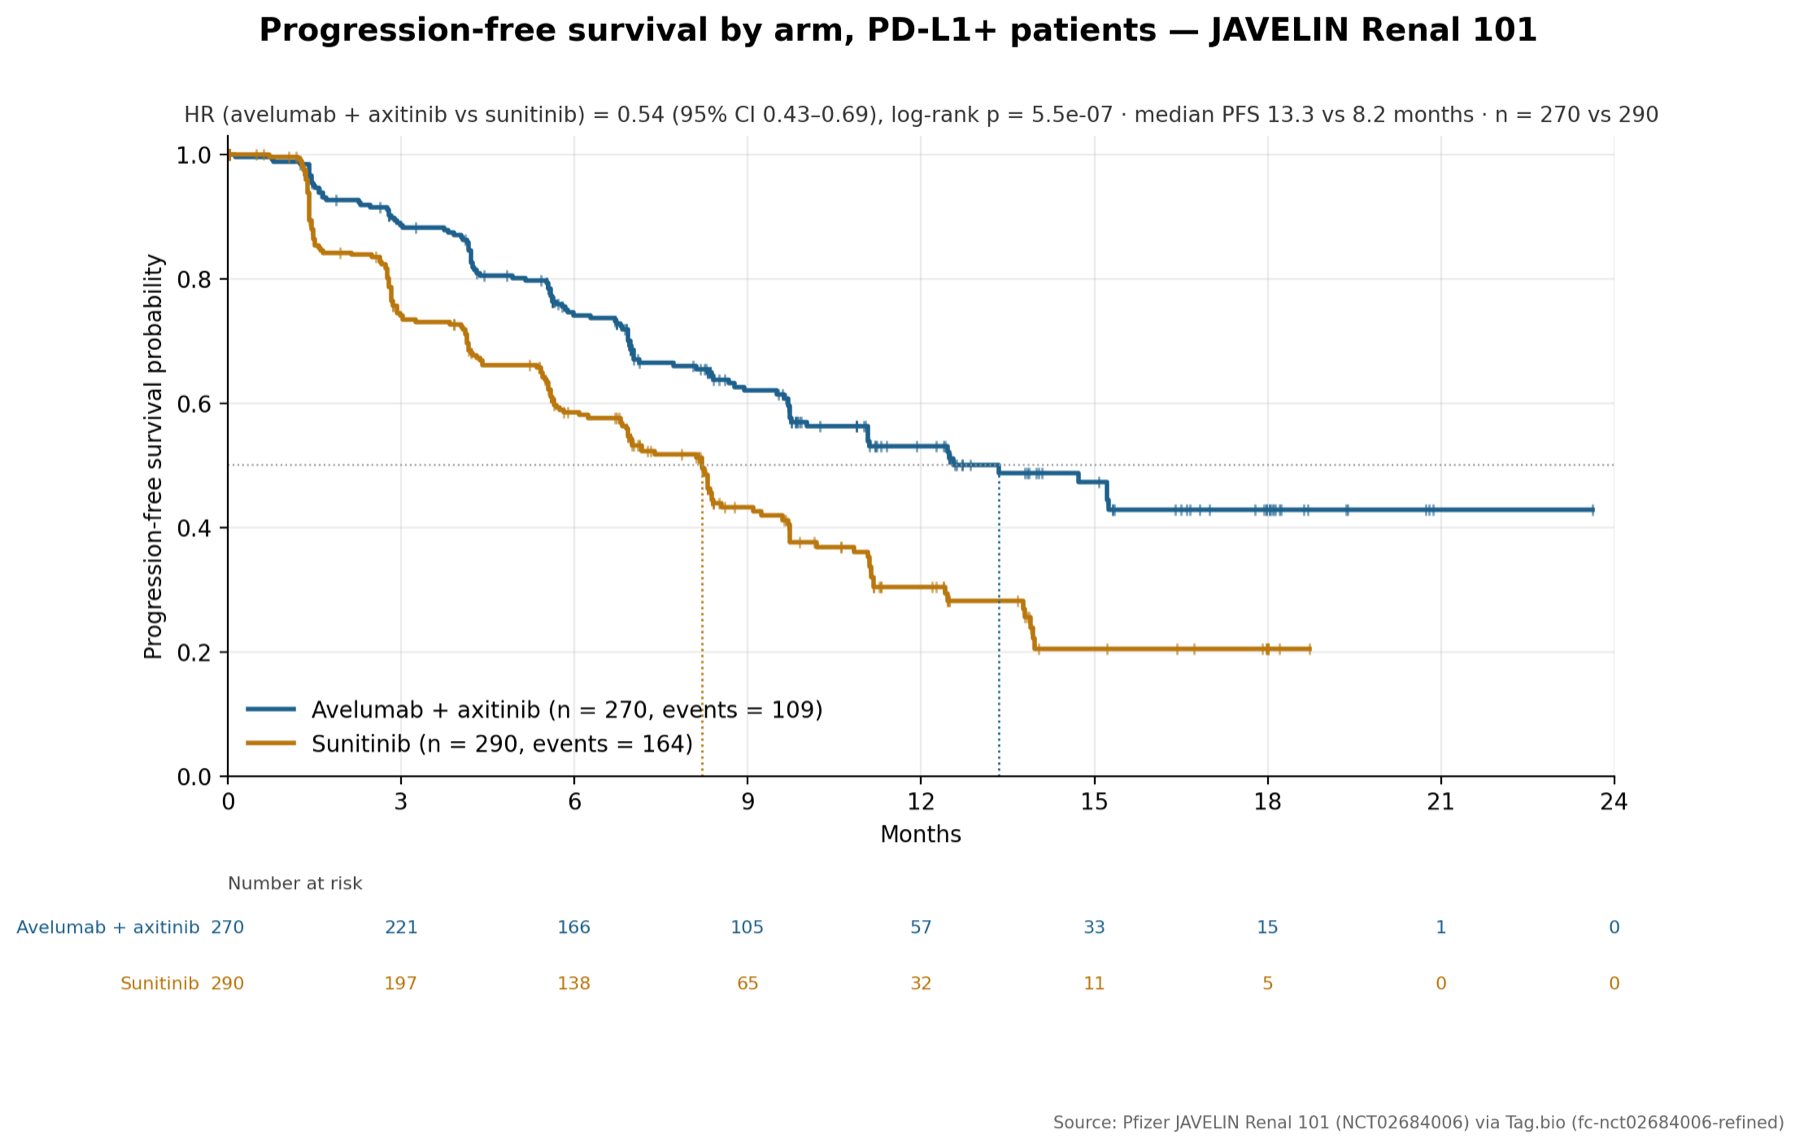
Tag.bio also holds full trial datasets. JAVELIN Renal 101 compared avelumab + axitinib with sunitinib in kidney cancer. This compares how long the disease stayed under control (progression-free survival) in patients whose tumors make PD-L1.
Why it matters: current trials
NCT02684006JAVELIN Renal 101, Phase 3 (the trial itself)
Prompt
In the JAVELIN Renal 101 trial (Tag.bio), compare progression-free survival between the two treatment arms for PD-L1 positive patients.
Follow-up for this figure
Draw the Kaplan-Meier curves for the two arms with the number at risk, the medians, and the hazard ratio with its 95% confidence interval in the subtitle.
Avelumab + axitinib vs sunitinib: hazard ratio 0.54 (95% CI 0.43 to 0.69), p = 5.5e-7.
Median progression-free survival 13.3 vs 8.2 months (270 vs 290 patients).
This is the data product's refined dataset; the published interim analysis reported HR 0.61.
What drives hospital cost overruns
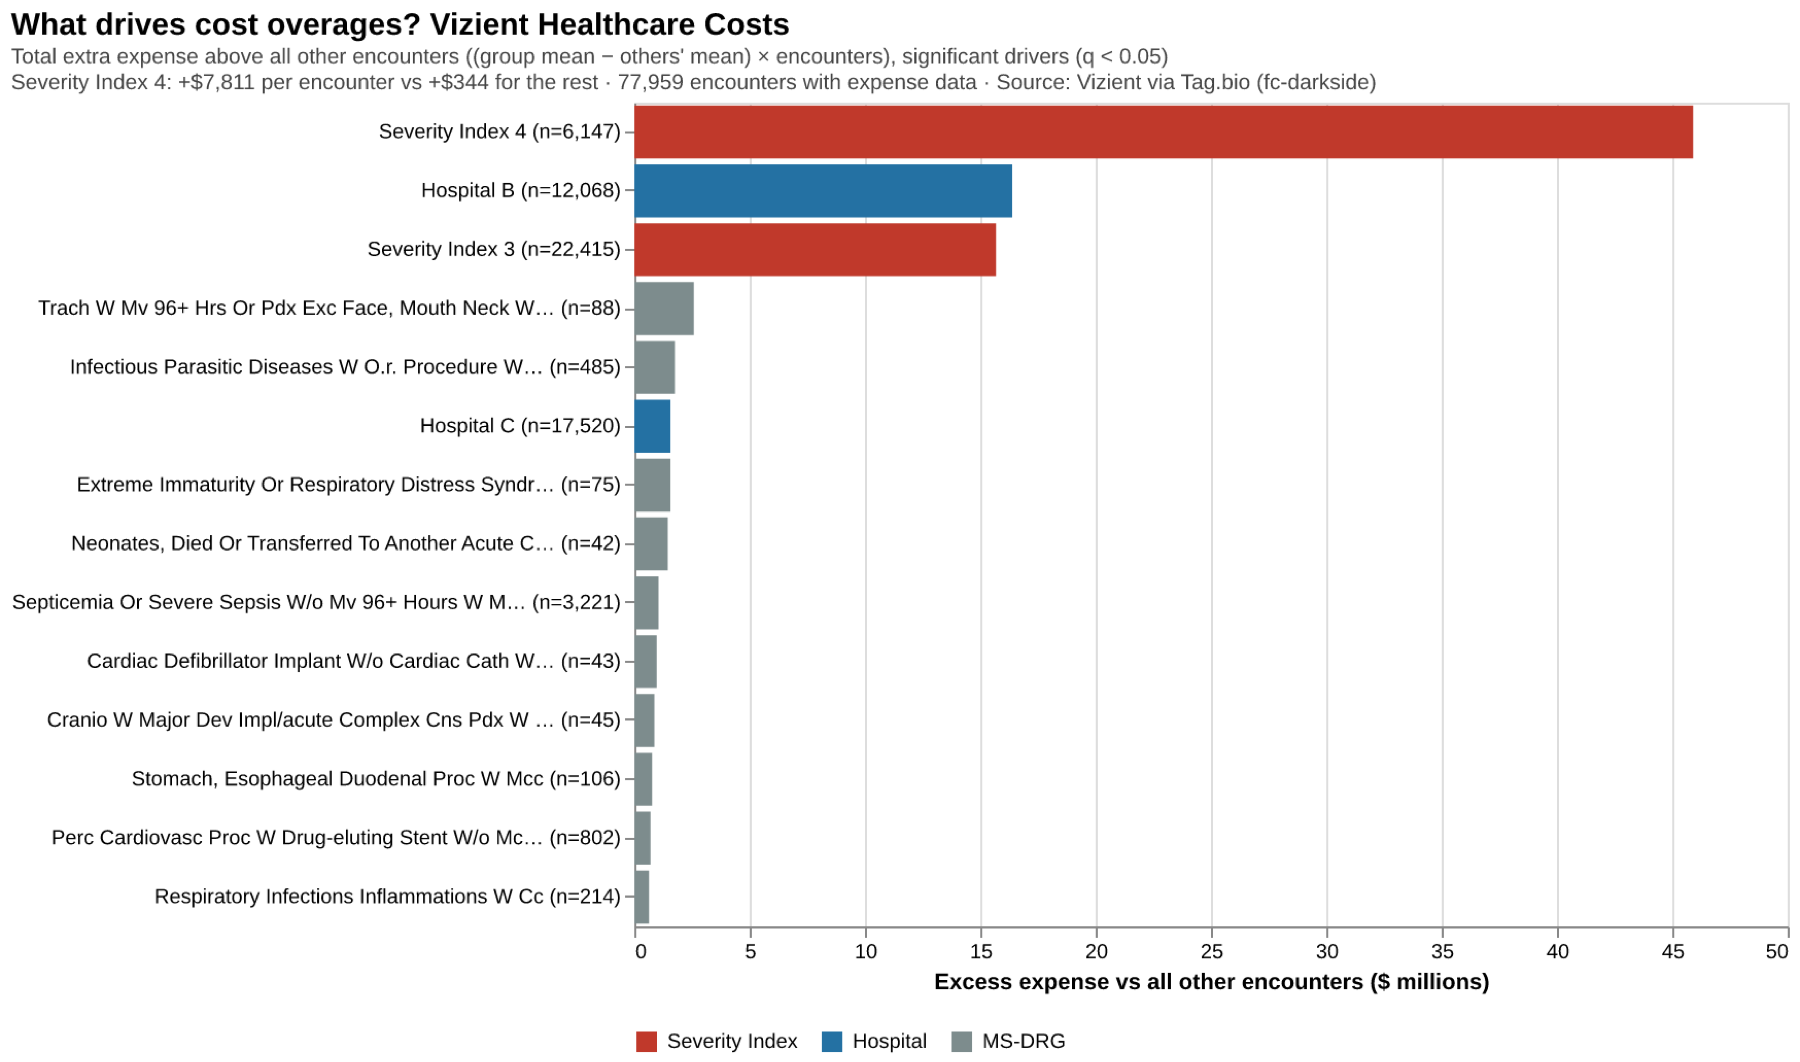
The Vizient data covers about 79,000 hospital stays. The built-in cost analysis finds which patient groups, diagnoses and hospitals run most over the expected cost.
Prompt
Using Tag.bio Vizient Healthcare Costs, what drives cost overages? Which diagnosis groups and hospitals stand out?
Follow-up for this figure
Rank the drivers by total excess dollars and show the top 14 as a horizontal bar chart colored by type (severity, hospital, diagnosis group), with the number of stays in each label.
Severity is the dominant driver: the sickest patients average $7,811 extra per stay vs $344 for everyone else.
Hospital B runs $2,080 over per stay across 12,068 stays (about $16.4M).
Patient stratification and current trials
Stratification means splitting patients into groups by their tumor's genes, because many new drugs only work for one group. Each example finds that group in TCGA and links trials that are testing a drug for it today.
TCGA mostly holds tumors removed at diagnosis, before treatment, while many of these trials enroll patients whose cancer has spread. Read the percentages as a guide to how common a group is, not as a trial's eligibility rate, and check ClinicalTrials.gov for current status and eligibility.
Uveal melanoma: who could get darovasertib
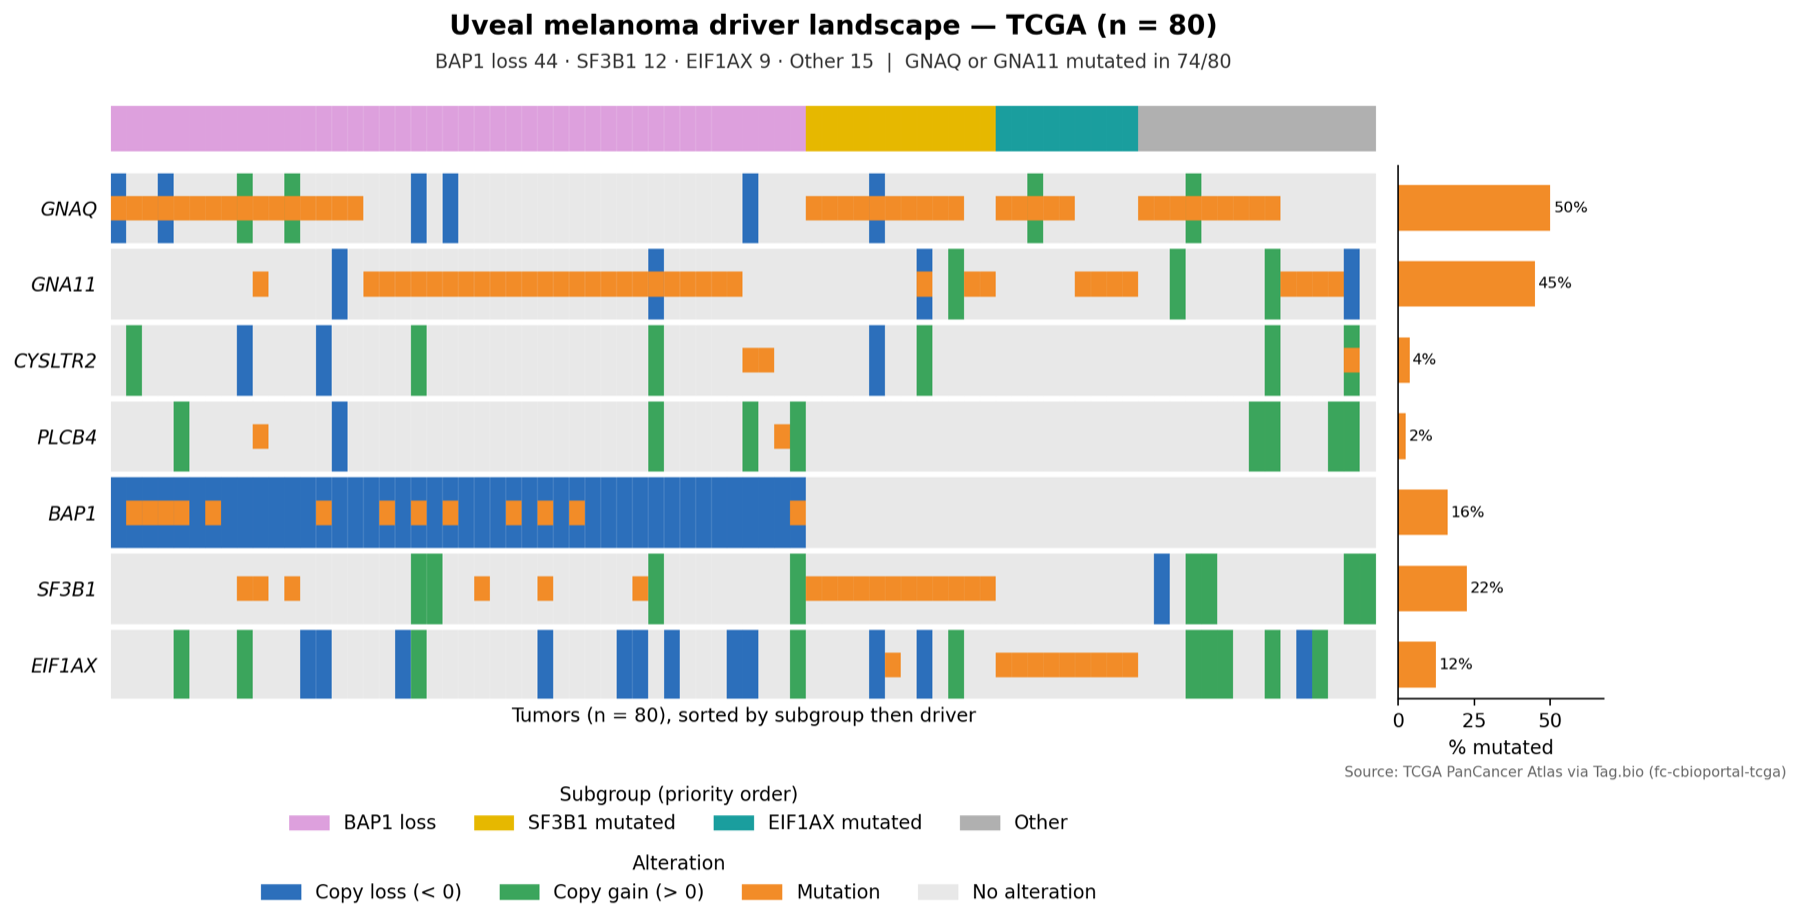
Almost all uveal (eye) melanomas start with a mutation in GNAQ or GNA11, and darovasertib blocks that signal. Tumors that have lost BAP1 are the most likely to spread, which is why trials of treatment before or after surgery focus on them. The oncoprint shows every tumor's changes and risk group in one picture.
Why it matters: current trials
NCT07015190OptimUM-10: darovasertib before local treatment, primary uveal melanoma, Phase 3, recruiting
NCT07804186Darovasertib + crizotinib after surgery, recruiting
NCT03947385Darovasertib in GNAQ/GNA11-mutant solid tumors, recruiting
Prompt
Using Tag.bio TCGA, pull all Uveal Melanoma samples with their mutations and copy numbers for GNAQ, GNA11, CYSLTR2, PLCB4, BAP1, SF3B1 and EIF1AX, and draw an oncoprint: one column per tumor, mutations and copy gains and losses colored, a risk-group band on top (BAP1 loss = high risk, then SF3B1 = intermediate, then EIF1AX = low, else other), and a bar chart of % mutated per gene. Tell me how many tumors have GNAQ or GNA11 mutated. Make it publication quality: a title, a subtitle with the key numbers, a legend and a source note.
GNAQ or GNA11 is mutated in 74 of 80 tumors (92%): the darovasertib-selectable group.
Risk groups: BAP1 loss 44, SF3B1 12, EIF1AX 9, other 15.
MTAP-deleted tumors: a new drug class
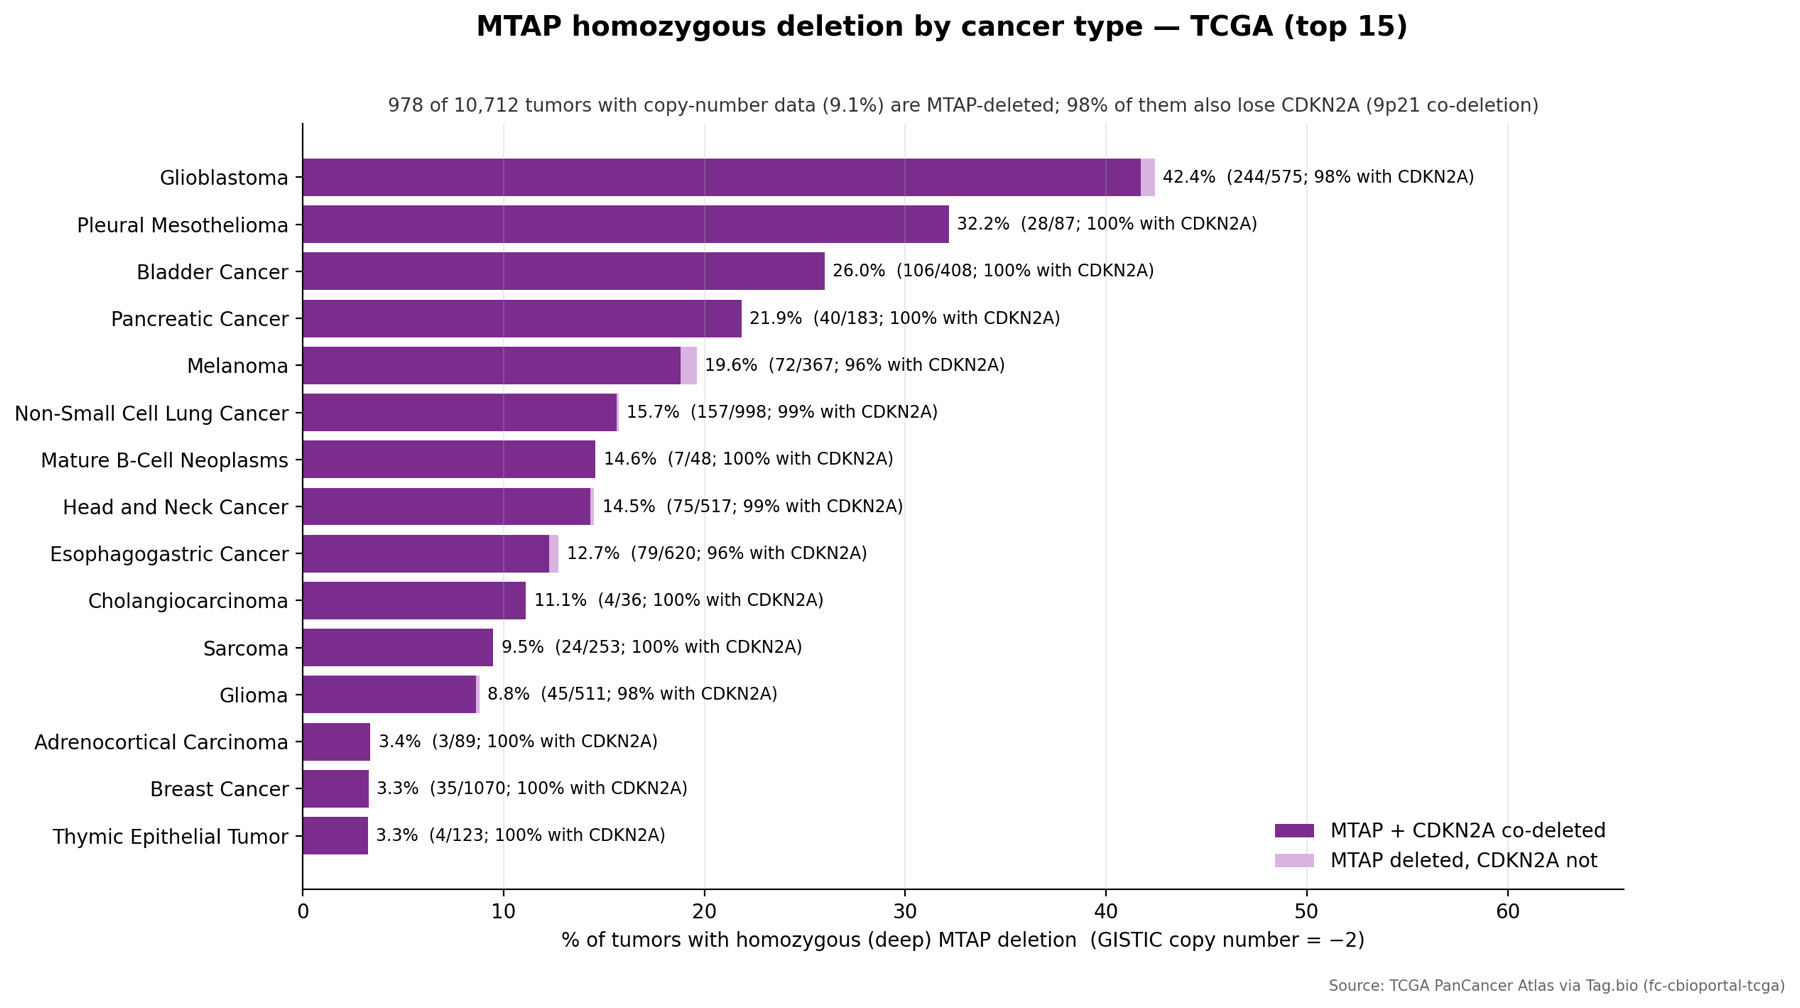
Some tumors have lost both copies of a gene called MTAP, usually together with its neighbor CDKN2A. That loss makes them vulnerable to a new kind of drug (PRMT5 inhibitors) that spares normal cells. How common is the loss in each cancer?
NCT07076121MountainTAP-30: navlimetostat in MTAP-deleted pancreatic cancer
NCT05245500MRTX1719 in MTAP-deleted solid tumors, recruiting
NCT05732831TNG462 in MTAP-deleted solid tumors, recruiting
Prompt
Using Tag.bio TCGA, what fraction of tumors in each cancer type have a homozygous (deep) deletion of MTAP? Show a sorted bar chart of the top 15 cancer types and how often CDKN2A is deleted too. Make it publication quality: a title, a subtitle with the key numbers, a legend and a source note.
978 of 10,712 tumors (9.1%) have lost MTAP; 98% of them have lost CDKN2A too.
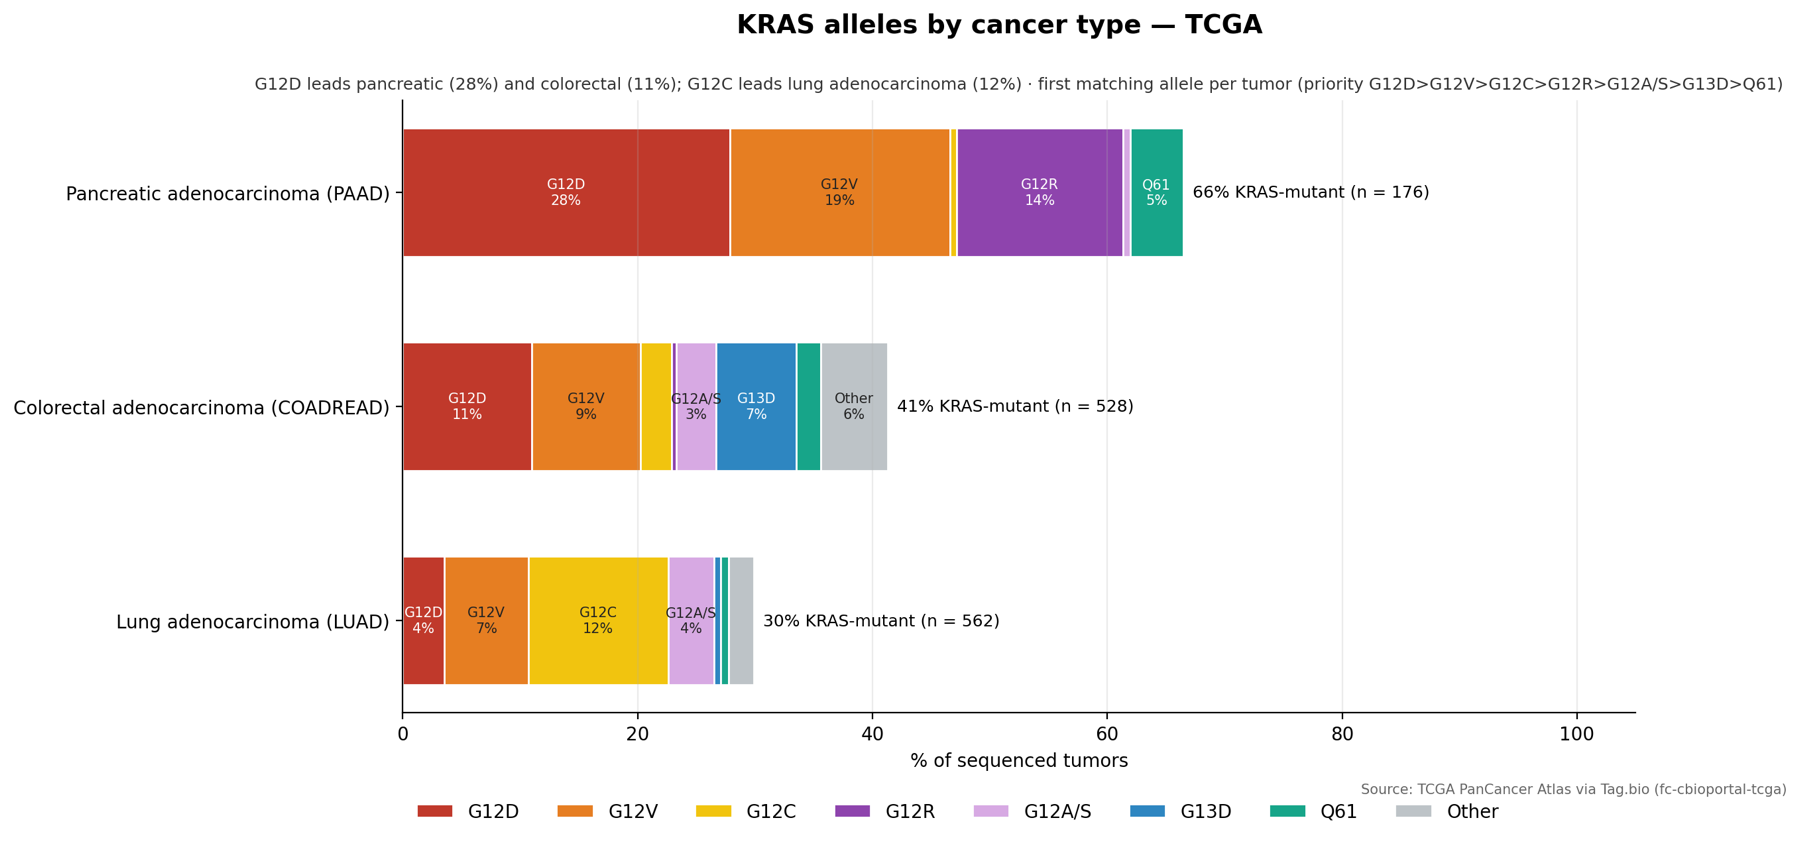
"KRAS-mutant" covers several different changes: G12D, G12V, G12C and others. New drugs target one specific version, so which one a patient has decides which trial they fit.
NCT06128551Elironrasib and daraxonrasib in KRAS G12C solid tumors, recruiting
Prompt
In Tag.bio TCGA pancreatic, colorectal and lung adenocarcinoma, which KRAS mutations occur (G12D, G12V, G12C, G12R, G13D, Q61, other)? Show a stacked bar chart of % of tumors per mutation by cancer type. Make it publication quality: a title, a subtitle with the key numbers, a legend and a source note.
G12D leads in pancreatic (28% of tumors) and colorectal (11%); G12C leads in lung adenocarcinoma (12%).
Clinical sequencing finds KRAS in about 90% of pancreatic cancers; TCGA's pancreatic samples contain few tumor cells, so some mutations are missed.
Lung cancer that resists immunotherapy
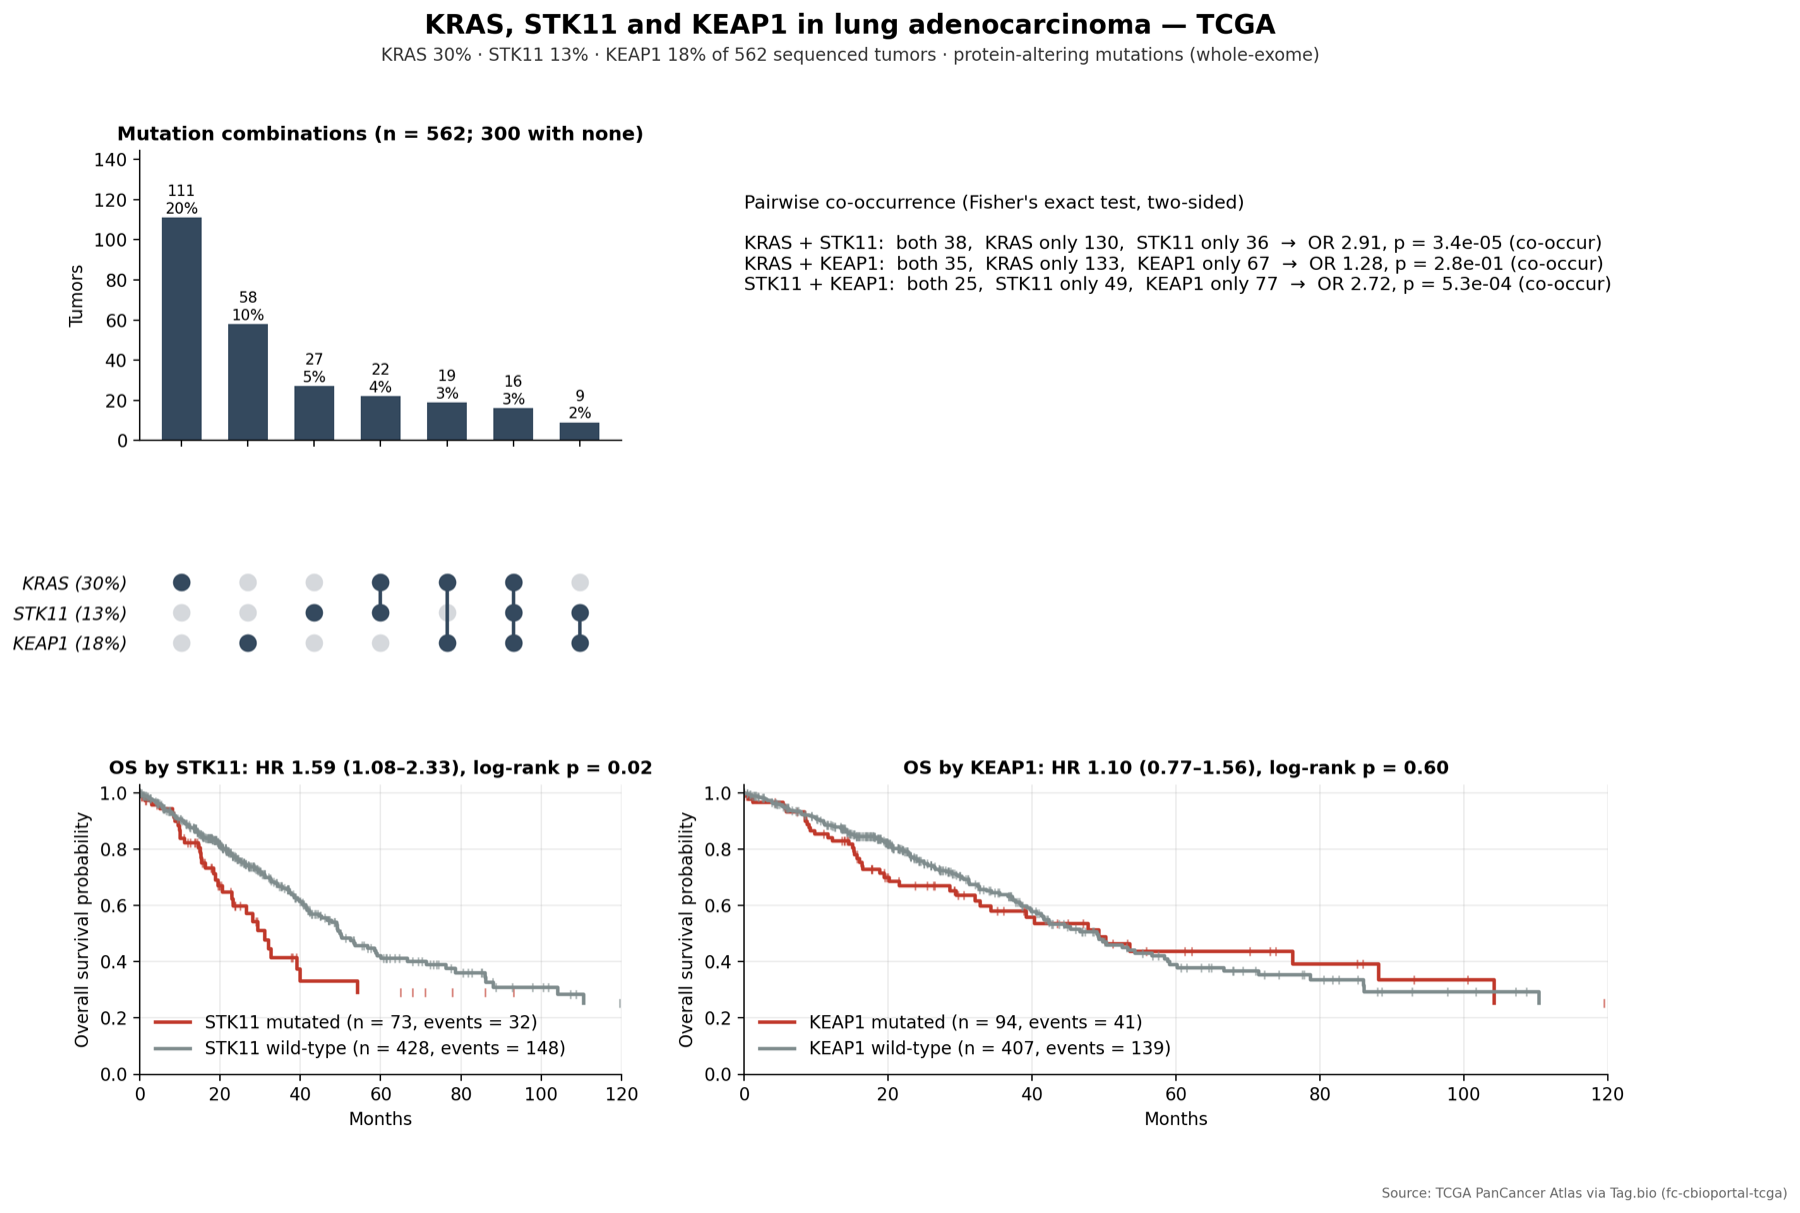
Lung tumors with STK11 or KEAP1 mutations often respond poorly to standard immunotherapy, especially alongside KRAS. Trials test stronger combinations for exactly these patients. How often do these occur together, and do those patients fare worse?
In Tag.bio TCGA lung adenocarcinoma, how often are KRAS, STK11 and KEAP1 mutated, alone and together (show an overlap chart)? Does overall survival differ for STK11- or KEAP1-mutated patients? Make it publication quality: a title, a subtitle with the key numbers, a legend and a source note.
KRAS 30%, STK11 13%, KEAP1 18% of 562 tumors; STK11 occurs with KRAS far more than by chance (odds ratio 2.9).
STK11-mutated patients live shorter (hazard ratio 1.59, p = 0.02); KEAP1 shows no difference here (p = 0.60).
Breast cancer: PIK3CA by subtype
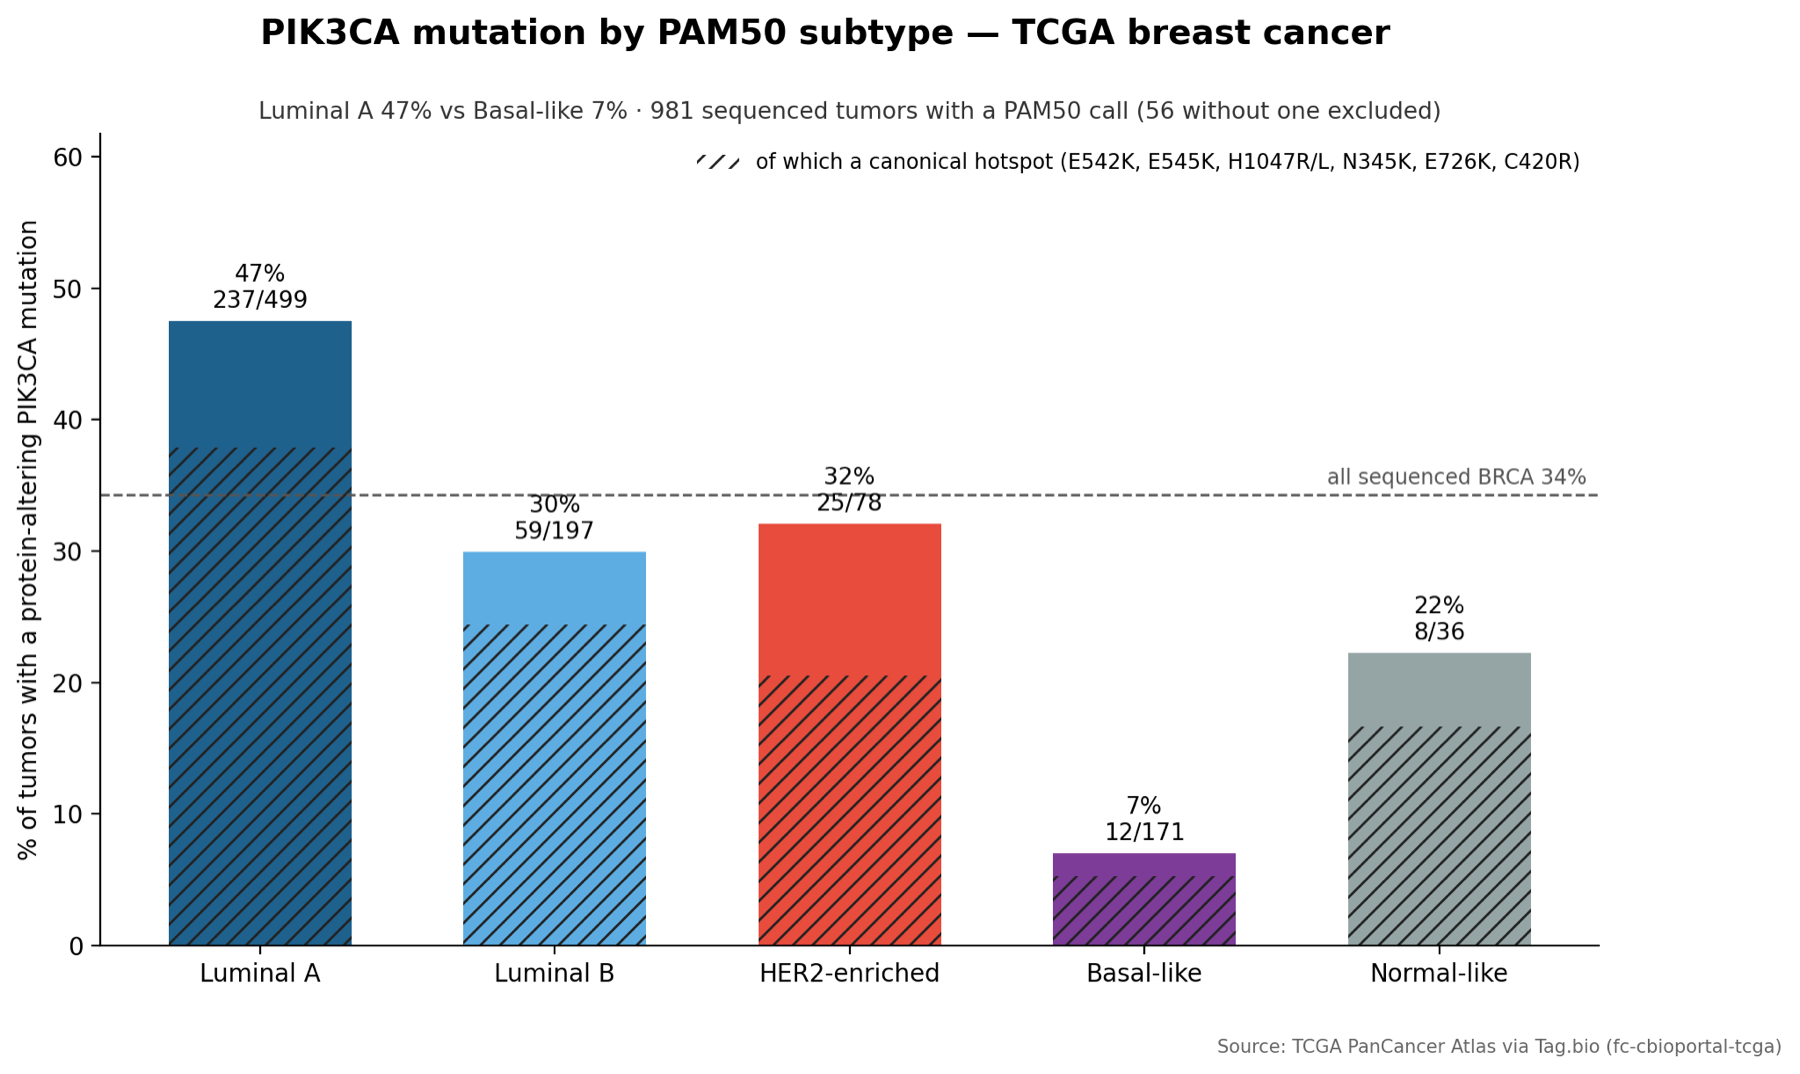
Breast cancer comes in subtypes (Luminal A, Luminal B, HER2-enriched, Basal-like). PIK3CA mutations, the target of drugs like inavolisib, are far more common in some subtypes than others.
In Tag.bio TCGA breast cancer, what fraction of tumors carry a PIK3CA mutation in each molecular subtype (LumA, LumB, HER2, Basal, Normal)? Show a bar chart. Make it publication quality: a title, a subtitle with the key numbers, a legend and a source note.
Luminal A 47.5%, HER2-enriched 32%, Luminal B 30%, Basal-like 7%.
The hormone-receptor-positive subtypes, where PI3K inhibitors are tested, carry most PIK3CA mutations.
Brain tumors: IDH status
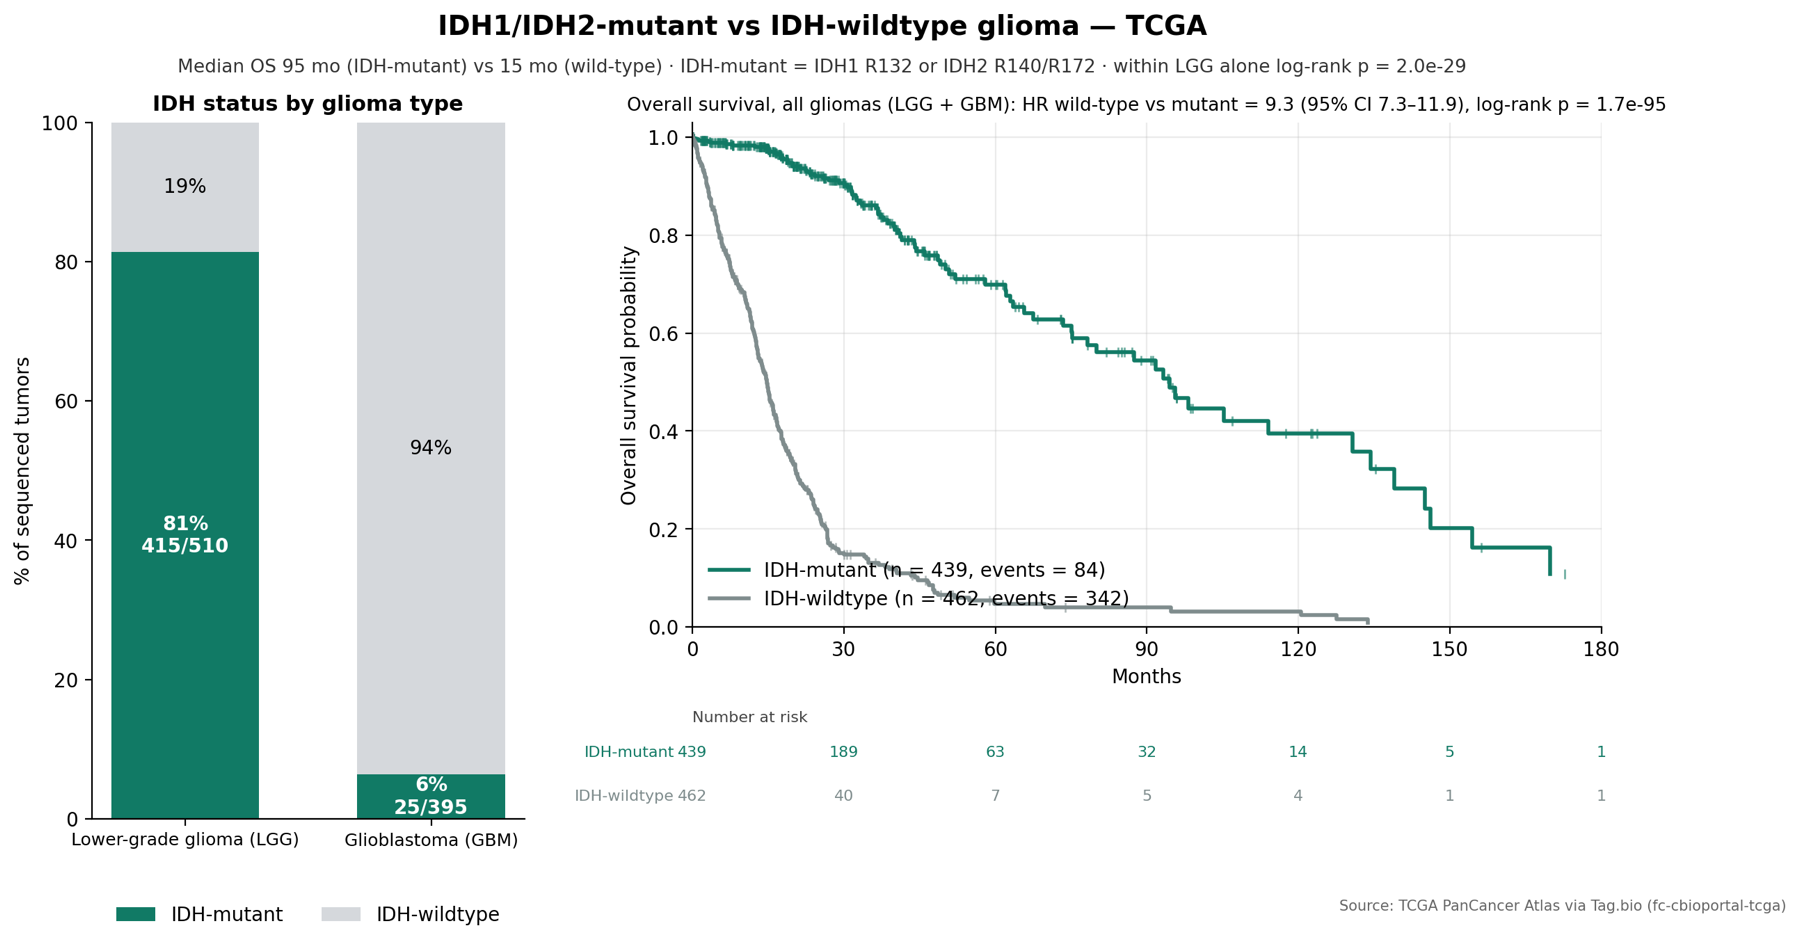
Gliomas with an IDH1 or IDH2 mutation grow more slowly, and patients live much longer. Vorasidenib blocks the mutant IDH enzyme. This compares survival by IDH status and shows how it separates slower-growing gliomas from glioblastoma.
Why it matters: current trials
NCT04164901INDIGO: vorasidenib in grade 2 IDH-mutant glioma
NCT06478212Vorasidenib + temozolomide in IDH-mutant glioma
Prompt
In Tag.bio TCGA gliomas, compare overall survival of IDH1/IDH2-mutant vs IDH-wildtype tumors (Kaplan-Meier), and show how IDH status splits lower-grade glioma vs glioblastoma. Make it publication quality: a title, a subtitle with the key numbers, a legend and a source note.
IDH-mutant in 81% of lower-grade gliomas vs 6% of glioblastomas.
Median survival 95 months (IDH-mutant) vs 15 months (IDH-wildtype).
Colorectal cancer: BRAF and microsatellite instability
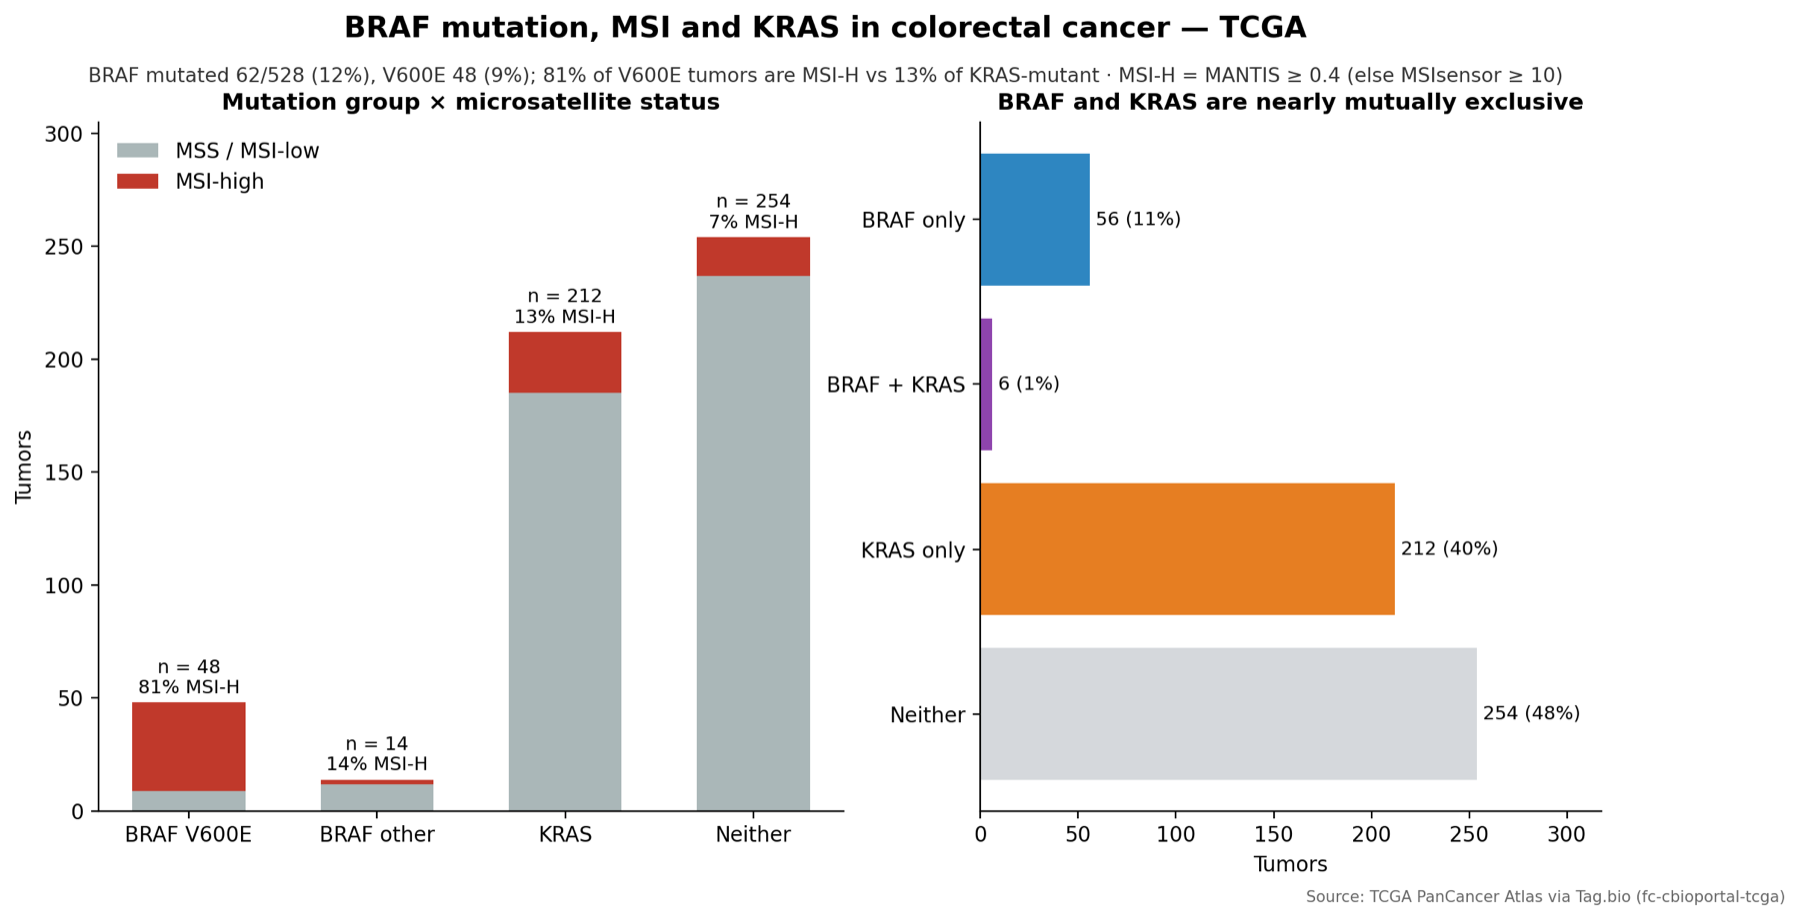
About 1 in 10 colorectal cancers has a BRAF mutation, usually aggressive and treated with encorafenib + cetuximab. Many of these tumors also have high microsatellite instability (MSI-H): their DNA repair is broken, which changes how they respond to immunotherapy.
Why it matters: current trials
NCT04607421BREAKWATER: encorafenib + cetuximab, first-line BRAF V600E colorectal cancer
In Tag.bio TCGA colorectal cancer, how many tumors are BRAF-mutated, and how does that overlap with microsatellite instability (MSI-H) and KRAS mutations? Make it publication quality: a title, a subtitle with the key numbers, a legend and a source note.
BRAF mutated in 12% (V600E in 9%); 81% of V600E tumors are MSI-H vs 13% of KRAS-mutant tumors.
BRAF and KRAS almost never occur together (1% of tumors).
Tips
Name the data product
Start prompts with "Using Tag.bio TCGA…" (or the product's name) so the assistant picks the right dataset.
Ask for the figure you want
Add "make it publication quality: a title, a subtitle with the key numbers, a legend and a source note". Follow-ups like "split it by stage" or "only metastatic patients" work too.
Prefer built-in analyses
Survival, UMAP, oncoprints and comparisons run inside the data product over the full data. Custom figures run in a secure sandbox next to the data; nothing leaves Tag.bio.